2010-09-29_1954_60_min_confirmation_checklist
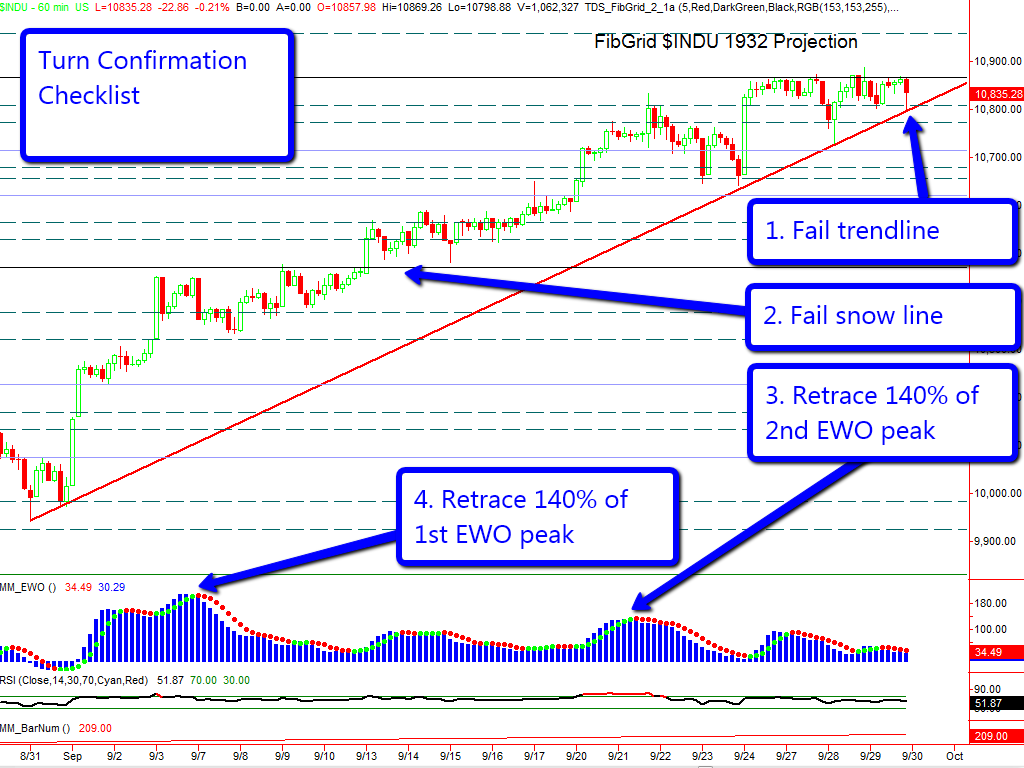
On another hourly chart, notice that we have several touches of a trendline up from August 31st lows. This level also supported the DJIA on its fall today. Since this level has now shown itself as support, one of the first things we would like to see to confirm a turn down is breaking this level and then holding below it, perhaps with a retest. It is the first in a list of things we’d like to see that will continually build confidence in a turn:
- Break trendline up from August 31st lows as discussed above
- Break below FibGrid 1932 snow line at 10,470 and hold below this level. This was resistance during the highest momentum portion of the move up and support when prices went above. Holding below would be a good sign of a turn. Additionally, if there’s any way to count the move up as a five-wave structure still unfolding then wave 1 likely ended near this level. Below it would then invalidate that count.
- An hourly EWO reading below -54 to retrace 140% of the second highest EWO peak. If this is a three-wave correction up, then the second peak is the third wave in C. Retracing 140% of that peak would be a sign that it is over.
- An hourly EWO reading below -84. This would retrace 140% of the highest EWO peak. This is for good measure.
- Breaking to new lows
- Perhaps most important: a wave structure that suggests five-wave movements down and corrective movements up. Without this, we won’t continue lower.