Gypsy Pivots
Voodoo Pivots (previously known as StockGrid, or Voodoo Pivots) is our take on pivot points. Like other pivot indicators it generates new levels of potential support and resistance which can be used for short-term trading. Unlike other pivot indicators, ours contains some of the same math that creates levels for our tremendously popular Voodoo Lines.
Because Gypsy Pivots is based on short term price action (and not long-running Elliott waves like Voodoo Lines) it can be used on just about anything you can chart: stocks, indices, commodities, and currencies. Which is best? For short-term trading it is a matter of personal preference. Most of our customers swear by Voodoo Lines and others prefer Voodoo Pivots, and there are even some who won’t trade without both. Our most important recommendation is to not put them both on the same chart at the same time or it will be too hard to read. Otherwise, we encourage you to experiment at which levels you like best.
Gypsy Pivots sells for $397 and is available for ThinkOrSwim, TradeStation, NinjaTrader and eSignal.
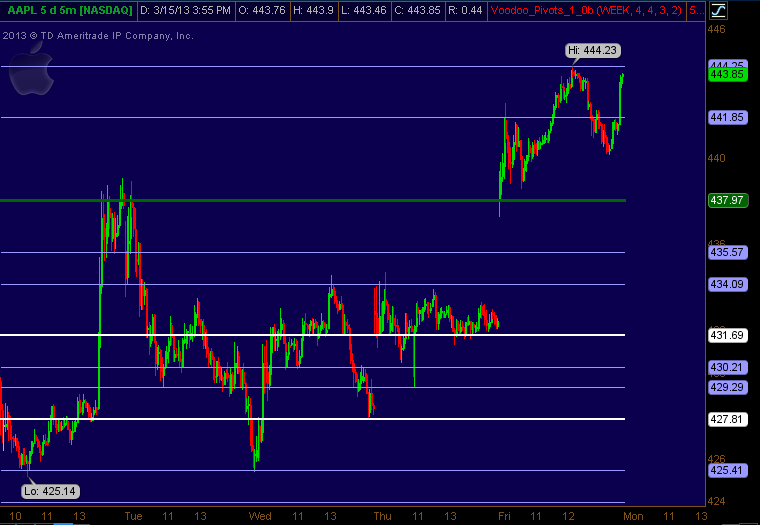
Example of recent trading in AAPL
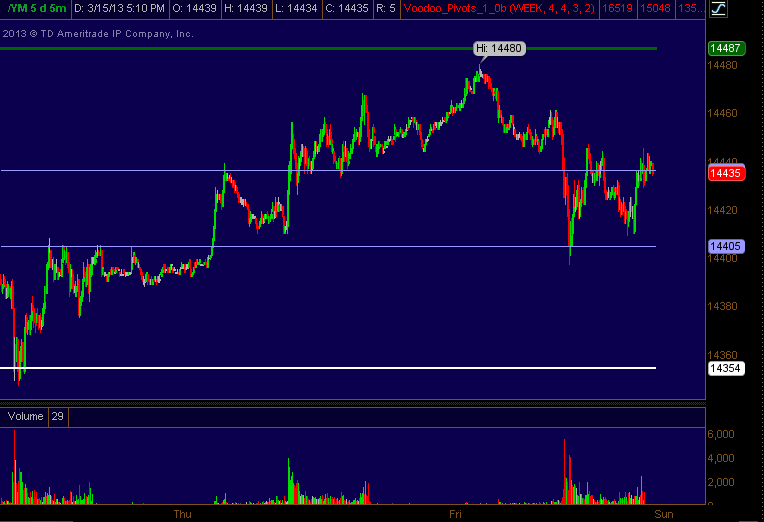
Example of recent trading in YM
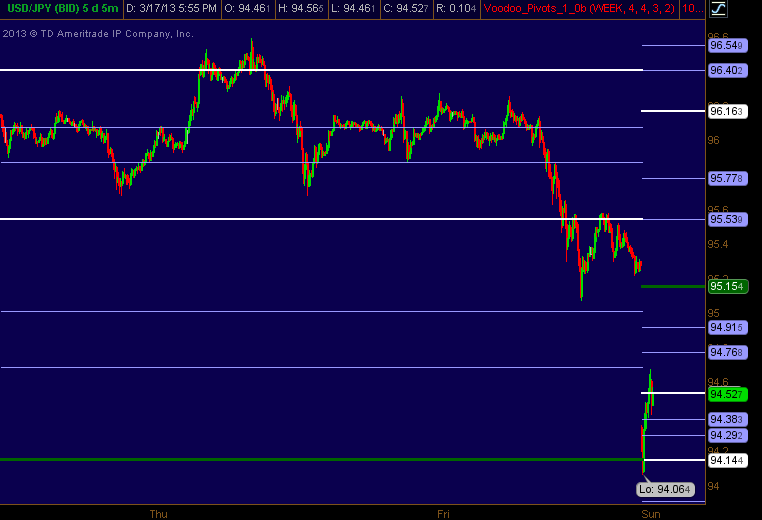
Example of recent trading in USDJPY
[/amember_protect]
Leave a Reply
10 Responses to “Gypsy Pivots”
Another winner from Dr. Starr
love this study. I wanted it for TS but its not ready yet. If I bought it for tos, would you still give it to me for TS. 😉
Mike
To get this to work properly on TradeStation it needs TradeStation version 9.0. 9.0 just went from “beta” status to “release candidate” status at the end of last week so the final release should be imminent. I’ll plan on polishing up StockGrid for TradeStation 9.0 this weekend.
Does StockGrid wrks with ETF’s like SPY and DIA, or Fibgrid is the better choice
FibGrid is the best choice for SPY, DIA, QQQQ, and IWM. All of these have been trading for long enough to display clear Elliott Wave structured needed by FibGrid and have the same basic wave count as the underlying indices.
StockGrid will work for those symbols and will show possible support and resistance, but they won’t be the same levels as FibGrid. It is interesting to watch both, but if forced to choose, I would pick the FibGrid levels.
StockGrid is the better choice to draw support and resistance lines on inverse or levered ETFs. However, even here I would still want to watch FibGrid on the underlying index. For example, if I was trading SDS I would put StockGrid on my SDS chart but I would also be watching the S&P 500 on a chart with FibGrid at the same time. If forced to choose only one in this example, I would pick FibGrid on the underlying.
For sector ETFs, including inverses those with leverage (thinks like SKF) StockGrid is the only choice except for Elliott Wave counting power users who can count out waves and configure the parameters. Even then this approach won’t work for all symbols.
TS ver.9 just went back into beta according to support last night, so I am not sure how long it will be before its out for good.
Shoot me an email if you have any of the other studies set up for TS 8.8. I have set most of them up, but their pretty weak overall.
mojoreef@gmail.com
take care
Can we use FibGrid with TradeStation on stock symbols ?
FibGrid for individual stocks on TradeStation would be cumbersome at the moment. You would need to create a wave count on your own for each stock and then set that in the indicator.
I hope to finish up StockGrid for TradeStation in the next few weeks. Also, as I mentioned in tonight’s webinar, I may start a new service to provide and regularly update FibGrid settings for a number of individual stocks if there is interest.
Is StockGrid available on any other platforms than TOS> Thanks
Hugh,
StockGrid is also available for both ThinkOrSwim and eSignal. I have some beta test versions on other platforms that may or may not be available commercially depending on interest. Contact me through email or using the contact link if you have an interest in another platform.
David