Voodoo Lines®
Voodoo Lines Give You An Edge
Every trader needs an edge and by taking advantage of the hidden support and resistance uncovered by Voodoo Lines you can make it your edge. When trading, one thing matters more than anything else: knowing the trend and the support and resistance from Voodoo Lines gives critical information to help you find it determine it. Trends may end at support and resistance, and when they don’t and make it cleanly through it’s an indication that trend is likely to continue. Put simply, you need to know where support and resistance are and Voodoo Lines helps you find it.
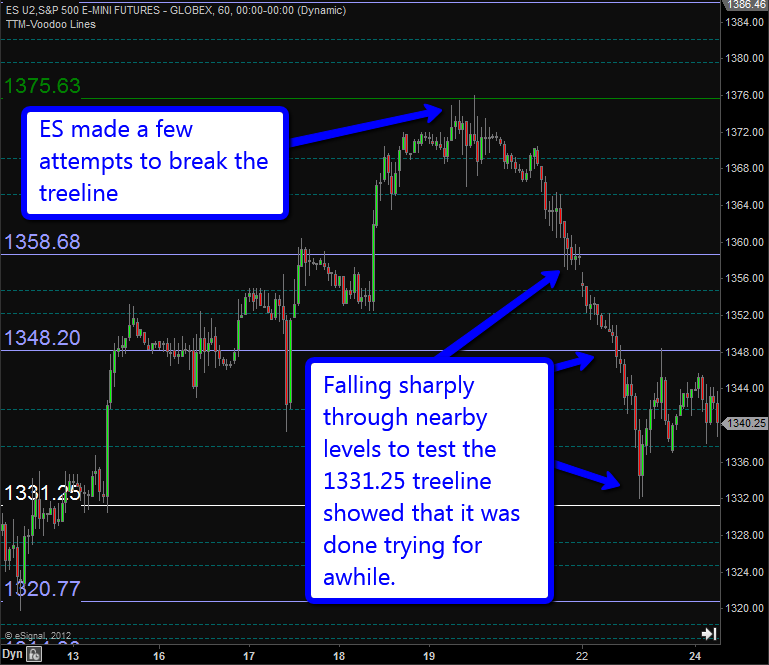
Voodoo Lines uncover support and resistance on ES futures.
I continue to have great success with Voodoo Lines trading the YM and I would not enter a trade without it… EVER! Yesterday for instance, I was shorting the YM on breaks of the Voodoo Line support levels…and killing it. It was dropping from support to support to support to the freekin’ tick!
— J. S. 8/24/2012
Buy Voodoo Lines Now ($997)
Voodoo Lines Are Different From Other Indicators
Trend lines, moving averages, pivots and many other indicators are often used to find possible support or resistance. All of them can be useful, but none of them do what Voodoo Lines can do. While levels for other indicators are always changing, Voodoo Lines stay in the same place. Not for days or weeks like pivots but usually for many years, sometimes decades. Because Voodoo Lines uncover important levels long before price reaches them, trading scenarios can be anticipated days, weeks, or even months ahead of time.
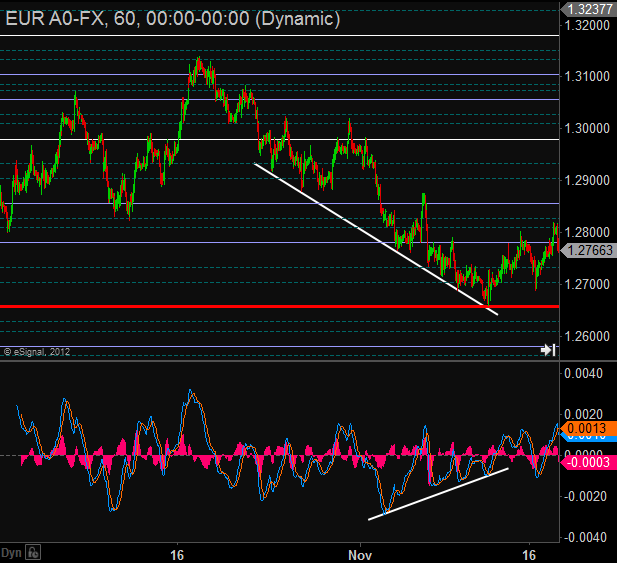
MACD showed obvious divergence as EURUSD approached the Fireline. This is the most significant level of support/resistance in Voodoo Lines and the setup warned of the reversal which came right at that level.
I use Voodoo Lines for my trading and found it the best indicator I have. If there was only one indicator to use with price this would be it. With price direction I can see where the stock is going. I watch as the price approaches a new Voodoo Linefor a possible exit. I also like to enter trades at a Voodoo Line and if price reverses I make a quick exit.
— P. A. 9/22/2010
Buy Voodoo Lines Now ($997)
Trading Ju-Jitsu
To many traders, “Elliott Waves” are dirty words. For every trader who swears by counting waves there are a dozen others who will tell you that the technique is either too confusing or too difficult. Perhaps the biggest challenge is that Elliott waves are subjective and analysts often disagree about how to interpret current price action. However, when we’re looking for an edge in trading we can look to turn weakness into strength, kind of like trading Ju-Jitsu.
Even if analysts disagree about the current wave structure, they usually agree about how to interpret what has happened long in the past since that action has concluded and one can see the results. Voodoo Lines are built by projecting levels based on these long-term wave structures where there is little ambiguity. By turning the usual challenges of Elliott Wave on their head we create a new tool which uncovers powerful support and resistance levels which any trader can use. The best part is, you don’t need to know anything about Elliott waves to use Voodoo Lines.
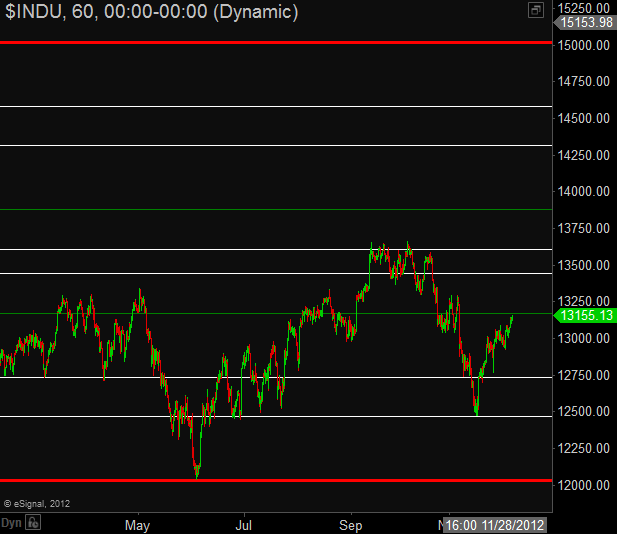
Levels projected from price action years ago generates levels which can be support or resistance for current trading.
I always spend quite a lot of time watching the indices. Voodoo Lines help give me a new perspective on what is otherwise very confusing.
— R. C. 10/26/2010
Buy Voodoo Lines Now ($997)
What Symbols Does Voodoo Lines Work With?
Each symbol included with Voodoo Lines needs to be analyzed by a real person and monitored to make sure the levels are appropriate. Therefore, it will not work with every instrument. When you purchase Voodoo Lines you will get support for a select list of:
- Stock indices;
- Stock index futures;
- Stock index ETFs;
- Commodity futures; and
- Currency pairs.
In addition, support for a select list of individual stocks is available through a separate subscription to anyone who has purchased Voodoo Lines. Below is a list of all the symbols available in the base Voodoo Lines and through the Stock Update subscription.
Voodoo Lines costs $997 and is available for:
- ThinkOrSwim;
- TradeStation;
- NinjaTrader; and
- eSignal.
Buy Voodoo Lines Now ($997)
I have been using and marveling at your Voodoo Lines for over six months, with scary success, but this one took the blooming cake…
Today, just before the market did its bungee dive at 3:30, I was long with an entry triggered by my breakout setup. I was following the price up the Voodoo Line ladder with a tight stop up close to 3 ES points… BANG! The bottom falls out, hitting my trailing stop… free fall! I watched transfixed as the next two one-minute bars dropped some 8 points in 120 seconds, taking out the 50 SMA and stopping dead on a Voodoo Line. I went OMG (actually, I said something else), shorted the quick bounce and rode it all the way down to the Voodoo Snow Line (some 5 points below) because I knew that was where it was going… and it did, some ten minutes later. I was so sure that this was final support that I even had the balls to go long off the Snow Line, after a 14 point unchallenged free fall.
What an Experience… It was poetry in warp speed motion. Your product is unbelievable and you should be enshrined in the Traders Hall of Fame. My hat is off to you!
Many thanks for making trading less stressful and a lot more enjoyable.
— J. S. 12/8/2011
Leave a Reply
Posts linking here
-
At Critical FibGrid Levels Now – What Traders Need to Know › First Wave Trader
-
-
-
-
-
-
16 Responses to “Voodoo Lines®”
Do you have now FibGrid for Crude Oil?
Thank you,
Pierre
All versions of FibrGrid have built-in values for NYMEX crude oil futures (CL).
Fib Grid combined with Dyna Range are a must have. I have used on Chart Range setting for several trades where had I not gotten out on the indicators my profit would have been substantially reduced. Nothing else was showing the need to Take the Profit.
Does FibGrid have built-in values for mini-gold futures (YG)?
FibGrid has values for the full size GC contract. Since the YM will typically track the GC you can use the full sized settings.
Can FibGrid be set to indicate shorter term Fib levels not necessarily from prior years, but intraday or weekly?
Trader197, Good question. I put together this video to demonstrate the answer and how one might create shorter-term levels: http://www.fwtrader.com/...ort-term-fibgrid-projections/
Since I ususally trade stocks, should I get fibgrid or stock grid? You have talked about fibgrid being updated for stocks, so I am not sure if fibgrid is the tool or not.
Great question!
Ever since FibGrid was created, people have been asking for a tool like it for individual stocks. StockGrid was the first attempt. I refer to StockGrid as being like “pivots on steroids.” StockGrid uses the same Fibonacci calculations as FibGrid. However FibGrid is based on long-term Elliott Wave calculations which can’t always be found for stocks. StockGrid gets short-term levels in a manner similar to pivots so it will work on any stock and really any security.
Many people use and like StockGrid and the levels often work well, but I still wanted something that would have the same power as FibGrid so I jumped in and started FibGrid Stock Update.
FibGrid Stock Update is a subscription add-on to FibGrid. With Stock Update I continually review the 150+ stocks (currently) that are included and update the values used for the long-term projections and I keep adding new stocks.
Updates to the indices, index ETFs, currencies, and futures included with FibGrid are included free. The extra uncertainty of wave count with individual stocks causes them to need more careful monitoring and changes, plus the sheer number of them means that the there are always some levels to re-calculate. So the only way I could reasonably produce something like FibGrid Stock Update is as a subscription service. That being said, having seen the levels on FibGrid Stock Update, I am constantly amazed.
StockGrid and FibGrid stock update each have their advantages. StockGrid will work on everything and it is a one-time fee. Stock Update is offered as a subscription, and produces the best support and resistance levels I’ve seen for individual stocks, but only works for stocks on the list. I use subscriber requests to prioritize new additions, but there is no guarantee that I can find wave values for every stock.