 One of our Elliott Squawk subscribers just turned me on to a great new charting package, MotiveWave. It’s pretty easy to grow immune to hype when it comes to claims made about trading products, but for Elliott Wave counters this thing ROCKS!!! Really!
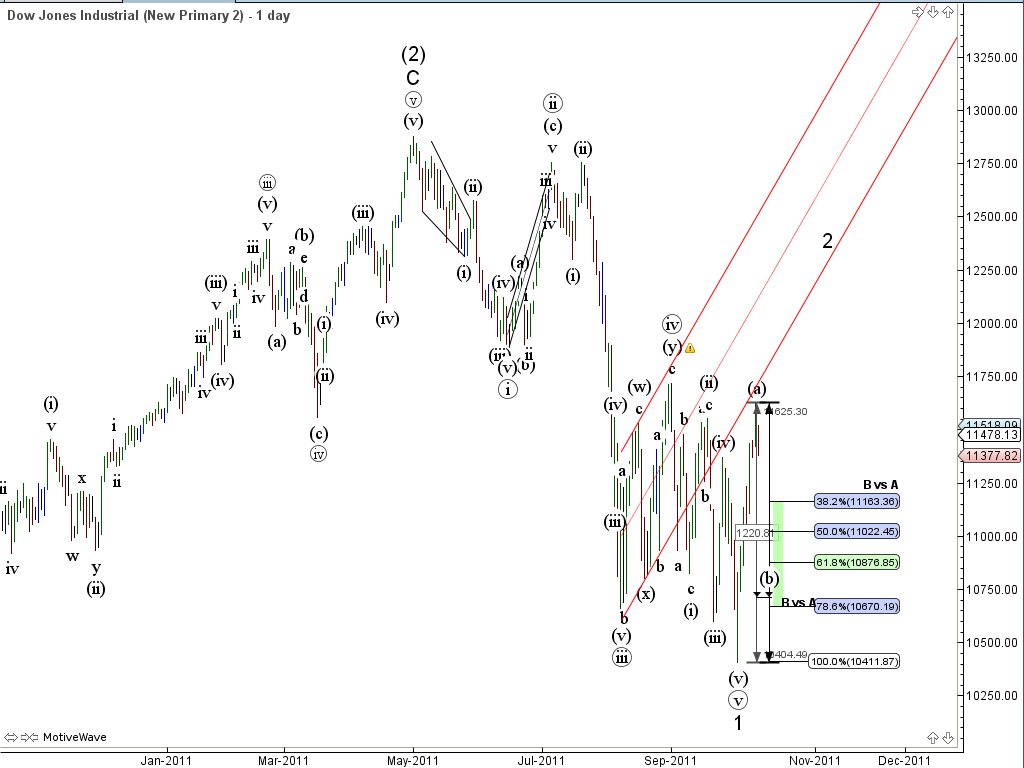
I have only been using it for a few days and I already know that this tool is a keeper. Not only does it make it much easier to count waves, the ease of maintaining wave counts is astounding. So let’s dispense with the hype and let me show you what this things does. It took me just a matter of hours to put my entire DJIA count into the tool. And I mean my entire count going back to the 1970s. Here is what the daily chart looks like:
[click to enlarge]
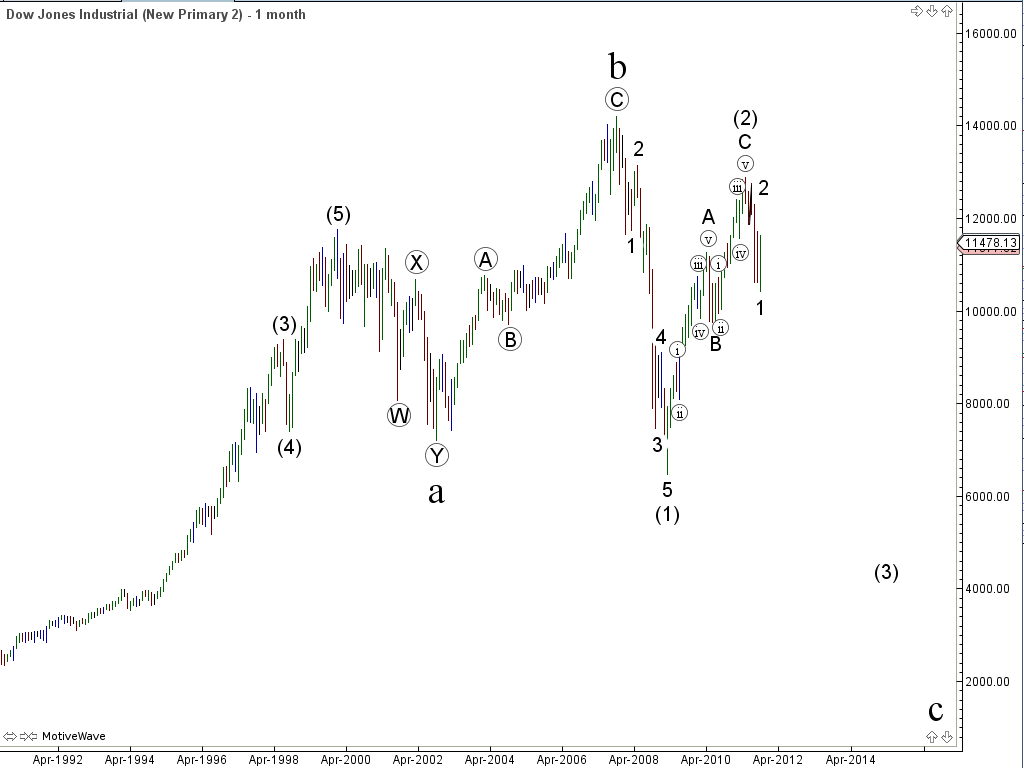
The first thing you notice is how professional the wave labels look. Before I had MotiveWave I built my own font in order to have labels that look this good on my charts. However, there is so much more going on that you can’t see just from the chart. These wave labels are not just text on a chart; just by drawing the wave structure on the chart you tell MotiveWave what the wave structure is. It knows enough to understand you and remember what you tell it. So as an example, when I zoom out to a Monthly chart it shows me the exact same count, but it hides the wave degrees that aren’t appropriate for the timeframe. Take a look:
[click to enlarge]
I can’t tell you how much time I spent copying wave labels from one timeframe to another before I had MotiveWave. Now those days are over. I told you before that that MotiveWave understands your wave count; well, it uses that knowledge to tall you when you do something that you might want to reconsider. So if you draw in an ending diagonal where wave 4 doesn’t overlap wave 1 it will tell you. In fact, it knows all the wave rules and will remind you if you’ve overlooked something.
Pictures don’t do justice to the Fibonacci extension and retracement tools in MotiveWave, but let me tell you that they’re the most functional and context-aware Fib tools I’ve used. In fact, there’s just about every tool a wave counter could ask for to make counting efficient and effective. But perhaps one of the coolest aspects of MotiveWave is its ability to count waves on its own. Yes, you read that right, if you don’t want to do the counting the software will give it a try. In my testing, it’s accuracy is so-so. I wouldn’t trust it to do my counting for me, but the auto-counting feature can be a tremendous time saver. One of the ways I use it, is that I sketch in the high level count and then ask MotiveWave to fill in the details. Then I just review the details. On occasion I need to change what it proposes, but this overall approach saves me a a huge amount of time.
Now, the platform isn’t perfect, but I’ve given up looking for the perfect platform. I use different tools for different jobs. For wave counting I’ll be using MotiveWave from now on. From my perspective the most significant thing that it lacks is FibGrid, but for the time being MotiveWave does not allow users to write their own studies. However, the folks who make the software have told me that if we send enough customers their way that they can work with us to add the capability. So if you do check out the software, be sure to use our links so they can count us and know how many of us there are.
And trying it out is probably the best way to discover everything that the software can do. MotiveWave offers a free 14 day trial.


4 Responses to “Discover MotiveWave” Leave a reply ›
Which of the 4 products are you using? Thanks
I’m using the Ultimate Edition which contains all the Elliott Wave tools.
I’ve been using Motive Wave for about a week now. I love the charts and the analysis tools and drawings it provides. It has lots of fib ratio tools, Gann tools and Gartley available along with the Elliott Wave lableling capabilities. It also has lots of technical studies available that I haven’t seen elsewhere.
Just like any new charting platform there is a learning curve, but after a week I’ve become real confortable with using it. Try it, you’ll like it.
Here’s one of the colored chart themes that is available and to the left you’ll see the Elliott Wave drawing tool bar. http://screencast.com/t/M0zr8q69Tv
Here’s the General tool bar http://screencast.com/t/lIE553zTD
Commentary tools http://screencast.com/t/iGiumlV0
Marker Tools http://screencast.com/t/MJhsb4xXv
Fibonacci Tools http://screencast.com/t/AV8iGVwZy
Gann Tools http://screencast.com/t/6D9AGCIkN
Gartley Tools http://screencast.com/t/kspEe26l