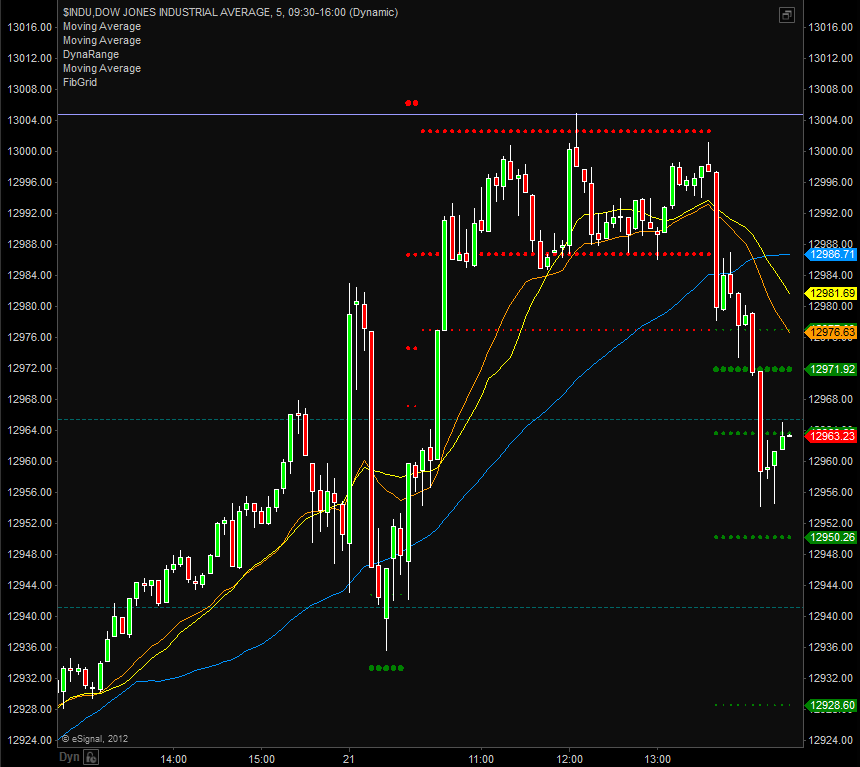
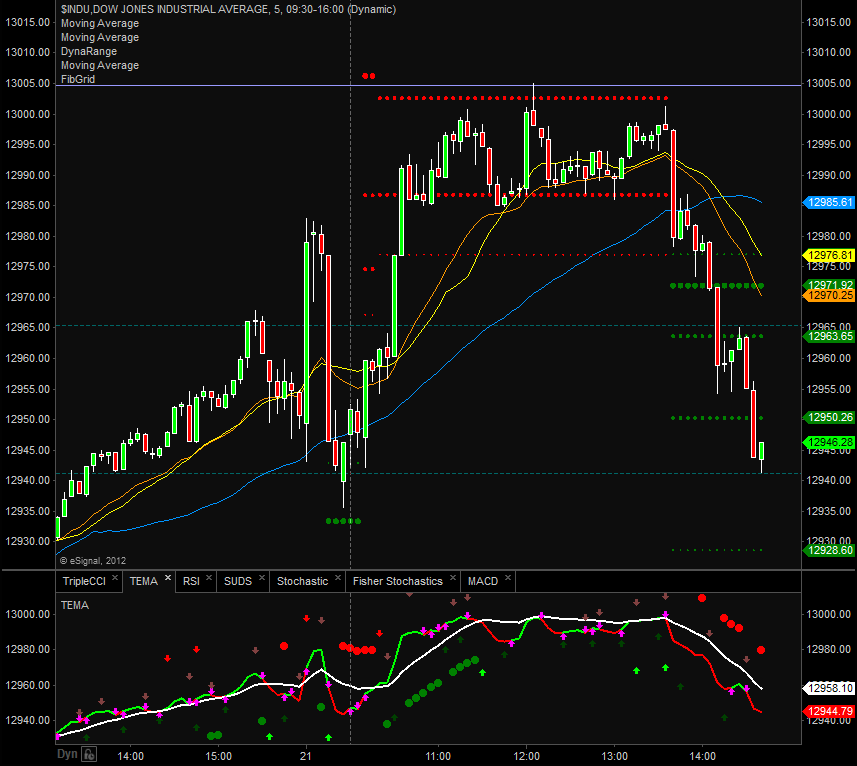
Today, the buzz in markets seemed to be about the Dow finally reaching 13,000. While many traders were paying attention to the round number, we had our eyes trained just a little bit higher at 13, 004.81. Why, because that is a FibGrid level and we know from watching markets day in and day out that prices have an uncanny way of going right to FibGrid levels.
You can see in our 5 minute chart that the DJIA went up and first touched 13,000 during the 11:20 am bar. But 13,000 wasn’t enough and it made another attempt just after noon and went $5.04 beyond 13,000 to finish just 23 cents beyond the lavender FibGrid “skyline” on the chart.
The nearby dotted red line is our DynaRange indicator, also used for identifying support and resistance. When it lines up with FibGrid, those are usually levels to watch, so we were paying attention to the level. Several of our indicators, including our TEMA crossover failed to confirm the breakout as prices hit new highs. Those are the sort of things we like to see.
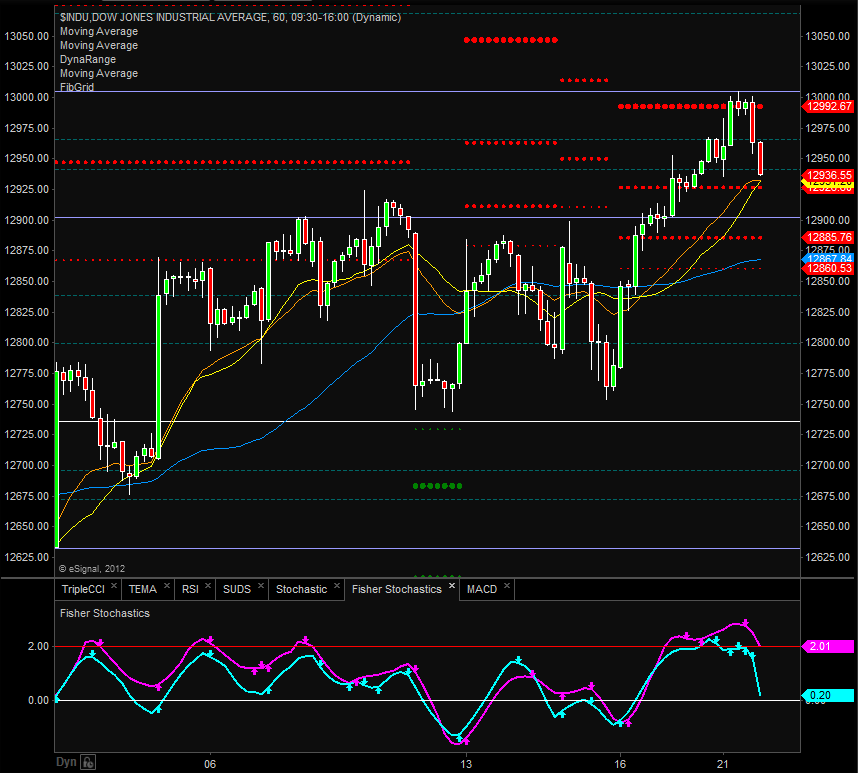
Looking forward, we want to figure out if this is just a pullback or an intraday turn. We can’t tell for sure, but there are some clues to look for. Pulling back to look at an hourly chart we can see our magenta Fisher Stochastic line rolling over in overbought territory. A cross out of overbought in this indicator would help signal some follow-through. More importantly, there is another lavender FibGrid “skyline” below us. A solid break of that level would likely target the area of the white “snow line” below it.
Whether or not we have a lasting top remains to be seen. But we can use FibGrid to mark the progress of the move and assess the likelihood that it continues, just like we used it to spot today’s intraday turn.
Fibgrid works with a variety of indices, currencies, and futures contracts. And now, current FibGrid users can extend the power to a list of individual stocks through FibGrid Stock Update. If you trade individual stocks, or just watch them to better understand where the indices are going, the FibGrid Stock Update can help enhance your understanding of direction.


No Responses to “Were You Watching Dow 13,000 or 13,004?” Leave a reply ›