2010-09-30_0734_eur_3min
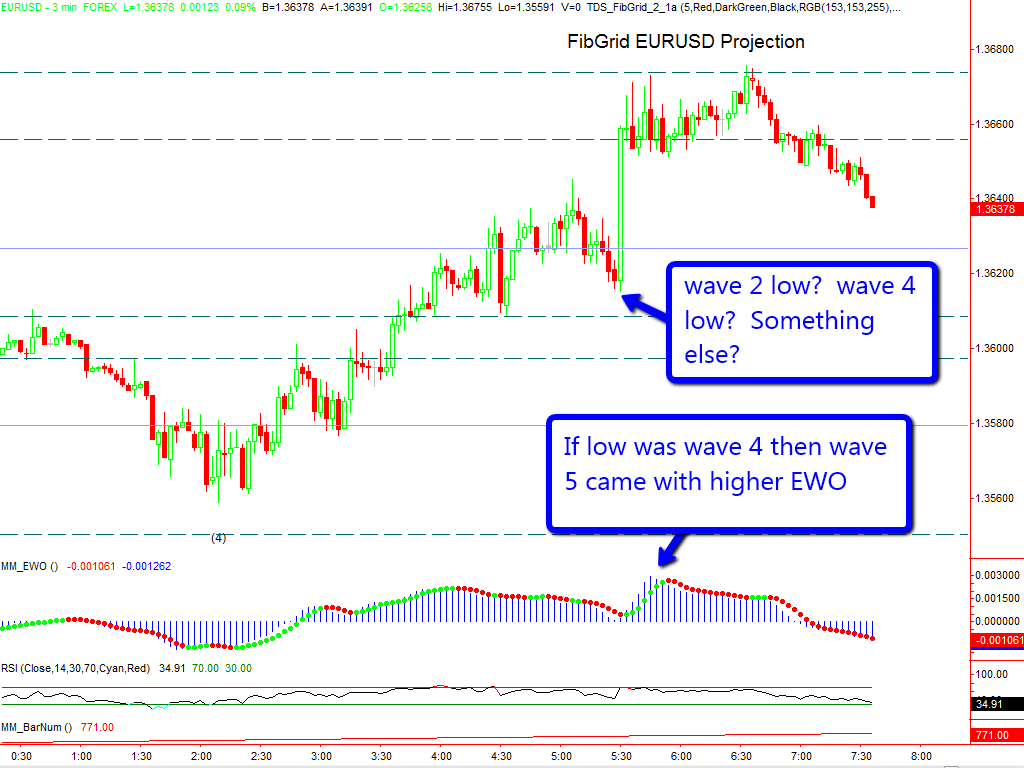
Drilling down to the three minute chart, it is possible that we have five waves up into highs around 6:30 am at FibGrid mogul resistance, but they don’t look convincing yet. On this chart, 7:30am weakness has already retraced more than 140% of EWO peaks, but that doesn’t mean we can’t have the move take longer which would suggest using a larger bar size. On a five minute chart (not shown) we would want to see EWO below -0.00146 before starting to think that this last fifth wave might be over.