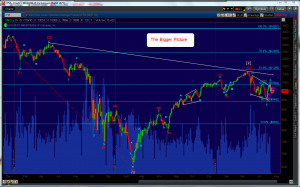
Here is a bigger picture look at the /YM continuos contract with the Elliott Wave count down from the October ‘o7 highs through the present. The “McFLY” picture from which I base my long term count and as a reference to base my projections on the longer term outlook. The labeling of the chart shows what I believe is the correct degree of wave labeling according to Elliott Wave Principle P27.
If you follow along with our daily posts, keep this chart in mind as a quick reference to subsequent wave counts.
As the chart shows, the October ’07 high was a very signifcant high from an Elliott Wave perspective. Robert Prechter identifies this high as the end of the B wave of an expanded flat correction of a 5 wave Grand Supercycle Degree bull market advance from the 1932 lows of the DJI average. His analysis says that we are now in the C wave of a Grand Supercycle degree. At this time I choose not to dispute his analysis and intend to analyze this count for the expected correction.
The projected path of this correction is an extemely signficant collapse of the stock market of Depression type proportions. So if that does indeed happen, the purpose of our analysis to to provide us and our readers some reasonable expectations of what we can expect on a longer term, daily and interday perspective.
First and foremost preservation of capital is of the utmost importance. Always remember “cash is an investment position” and if there is any uncertainty of direction, the best strategy is to “Sit on Your Hands” and wait for the market to provide you with a more clear perspective.

No Responses to “The Big Picture” Leave a reply ›