The Squawk’s most likely wave count continues to show U.S. equity markets in a primary wave [3] down. While third waves are known as particularly rambunctious, this one has remained mired in various degrees of first wave downward action and upward second wave correction. While Friday’s mid-day bounce is likely yet another small degree second wave, once complete it will likely mark just the latest in a string of second-wave corrections that have prepared the market for a signficant decline ready to unfold.
As we prepare for a new trading week, we look to the opportunities afforded by these wave structures as we plan high probability trades.
Dow Update
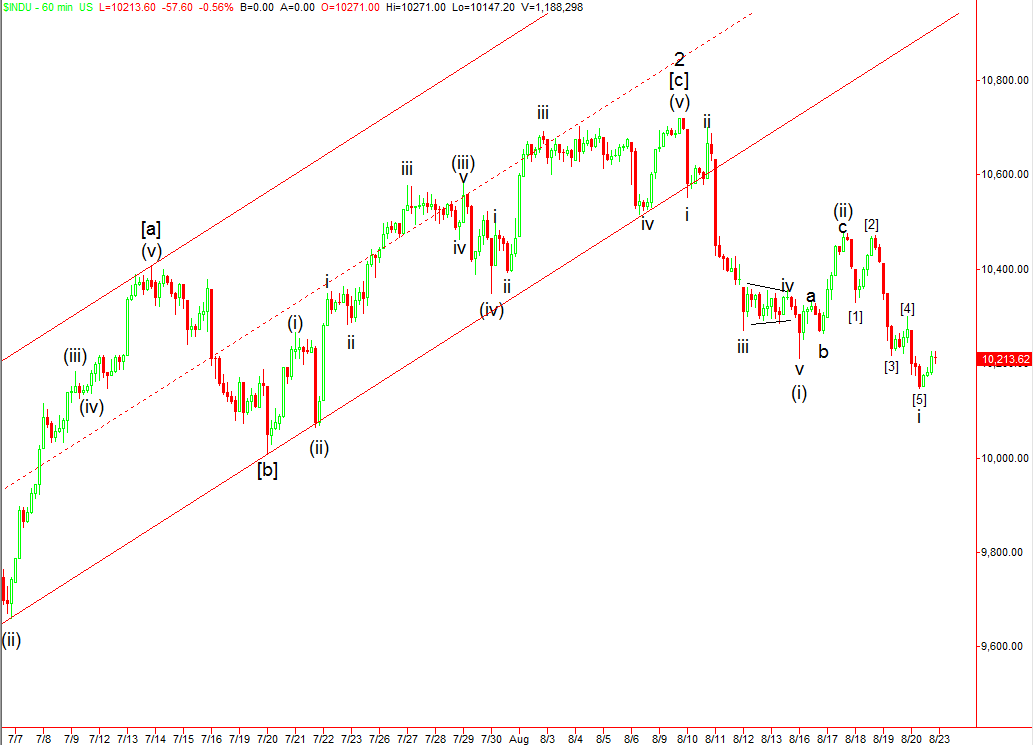
Friday’s fall removed any doubt that wave (ii) might be trying for some form of complex correction. Although by Thursday’s close the only reason to still suspect the possibility was the extremely deep wave [2] correction and the markets tendency to create confusing second wave action for over a year now. Friday’s action has left us with what appears to be a clear 5-wave movement down from the 10,719 high on August 19th. Seeing 5 waves down tells us that this is now the direction of trend. The hourly chart of the dow shows the five waves down in (i) as the dow fell out of the upward channel we had been tracking.
[click image to enlarge]
In anticipating that wave i is now also complete, we take confidence in several things:
- It counts out complete, has a good “look”, and meets all the proper characteristics.
- Technicals show the classic indications of a five wave strucutre. We’ll review these in a moment.
- The larger correction from Friday’s low suggsts it is likely complete
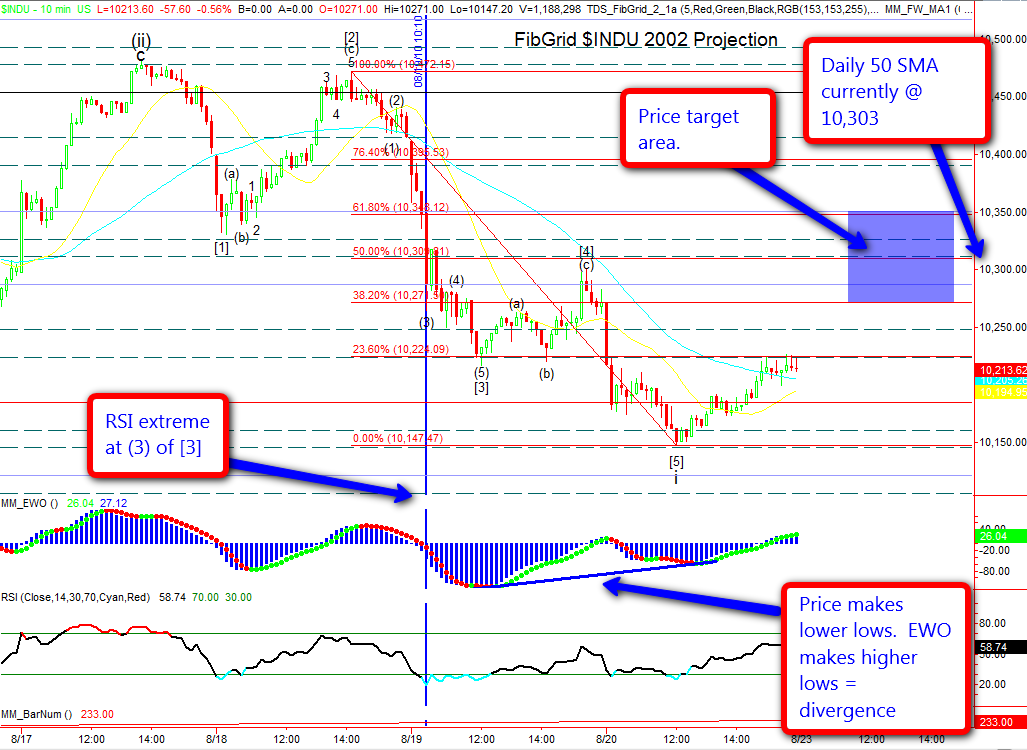
We can look at this on an 10 minute chart which has just over 100 bars for the entire movement. The technicals show us a number of classic attributes:
- The extreme value of RSI lines up with wave (3) of [3].
- The Elliott Wave Oscillator has its extreme value of -127.79 within wave [3] and therefore also shows divergence at the wave [5] low.
- The typical extreme Elliott Wave Oscillator values for wave [4] should have a 90% to 140% retracement of wave [3] extremes which would be between -12.78 and 51.12. The actual wave [4] value was 20.84, well within that range.
Based on this, we are now looking for an end to wave ii prior to a return to a down move. As we currently have our wave degrees labeled, that down move would be wave iii of (iii) of [1] of 3 of (1) of [3]. With the expectation that several degrees of third wave will coincide, it has the potential to be a strong downward move.
[click image to enlarge]
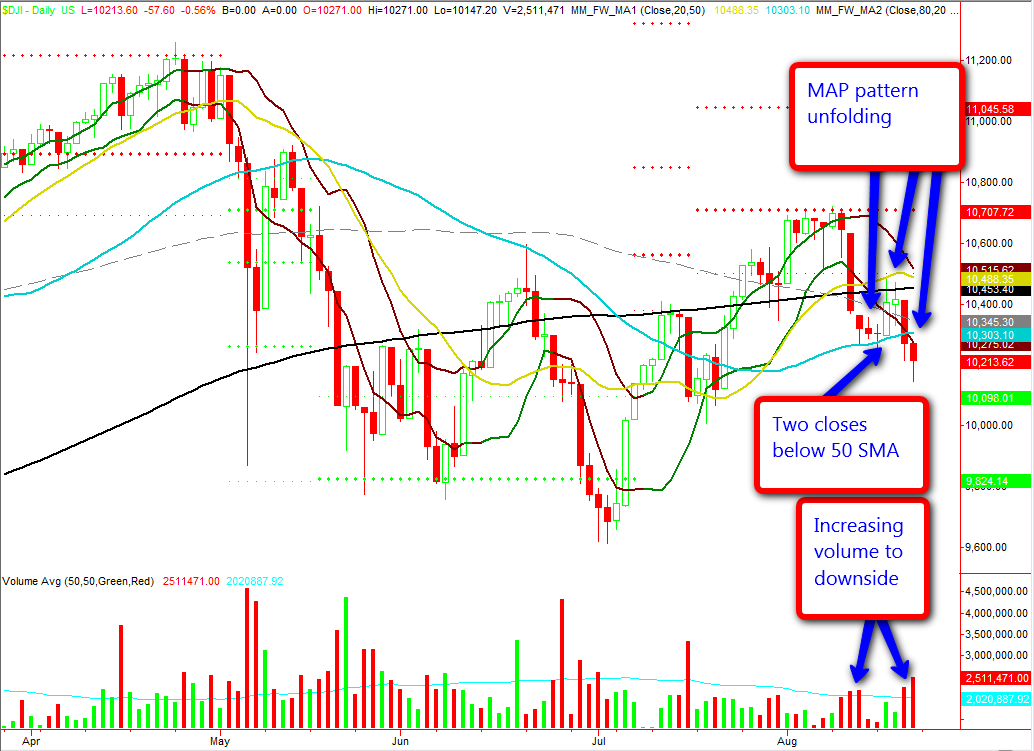
We are seeing some of the same indications from many of our other technical indicators and patterns. On a daily chart we can see that The Dow has had two closes below both the 50 SMA and MOBO. This is the penultimate step in a potential MAP pattern where it breaks below the 20SMA, bounces from the 50SMA to fail a retest of the 20. It has now broken the 50 as predicted and should retest the 50 before falling if the pattern completes. We are seeing an uptick in volume with red volume bars eclipsing green ones. Volume on Friday can be dismissed due to options expiration, but the chart shows this to be more than a one-day phenomenon.
[click image to enlarge]
If price does complete the MAP pattern it would coincide with a reasonable target for the end of the wave ii that we are expecting from our Elliott Wave analysis. It is possible that wave ii at friday’s highs which would be near a 23.6% retracement level. This is a Fibonacci target, but a rare, shallow one. A 38.2% to 61.8% retrace would be more common. Within this range we also see the daily 50 SMA at 10.303 and FibGrid skyline at 10,287. Even more important than the levels is to spot a completed corrective wave structure. Levels will just serve to reinforce the likelihood of a complete wave ii if we can count the move complete at a predicted level. That’s exactly what we’ll be looking for during the early part of the week.
EURUSD Update
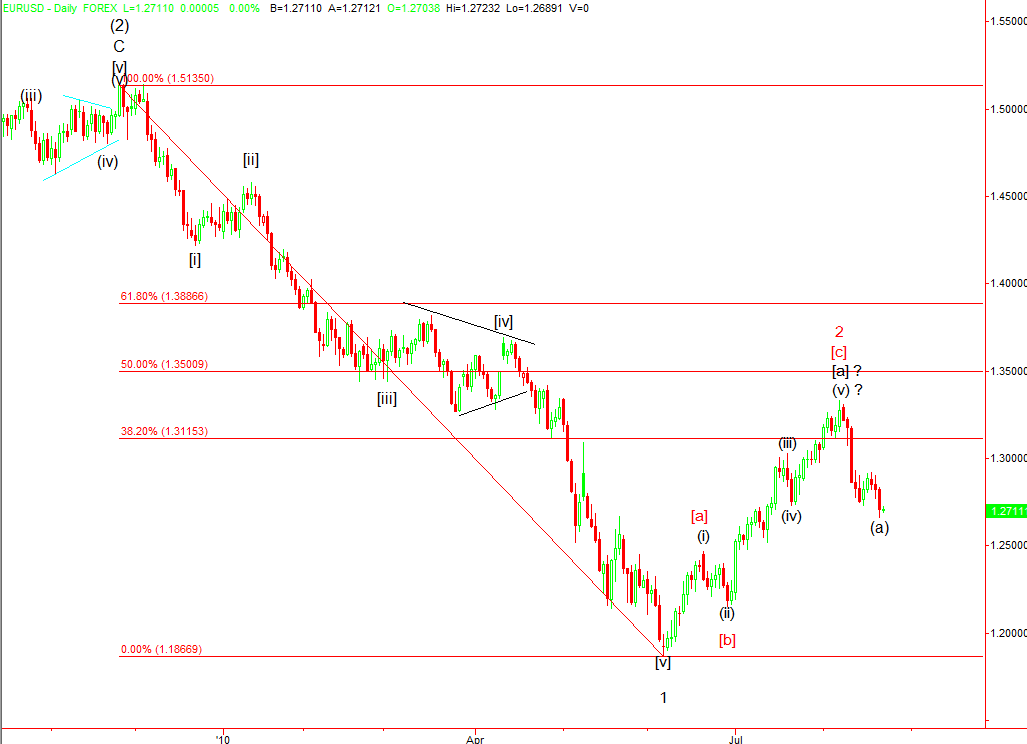
For the moment, the Euro looks like it will continue down. However, unlike U.S. equities, it’s unclear that it is yet ready to make new lows for the year. While that possibility might be in the cards as shown by the red count on our daily chart we want to remain aware of the black count’s suggestion that the current down move is just a [b] wave within an upward correction. The difficulty in determining which scenario is likely comes from our ability to count the rise from June lows as either a three-wave correction or a five-wave impulse move. While that doesn’t clear up the medium-term view, it does suggest that prices still need to continue lower, either to complete a downward correction for [b] under the black count, or to complete a five-wave move down for a red [i] as the start of a larger downward run. Both counts also suggest new lows in the longer term, the black count just needs to see a higher correction of wave 1 before making new lows.
[click image to enlarge]
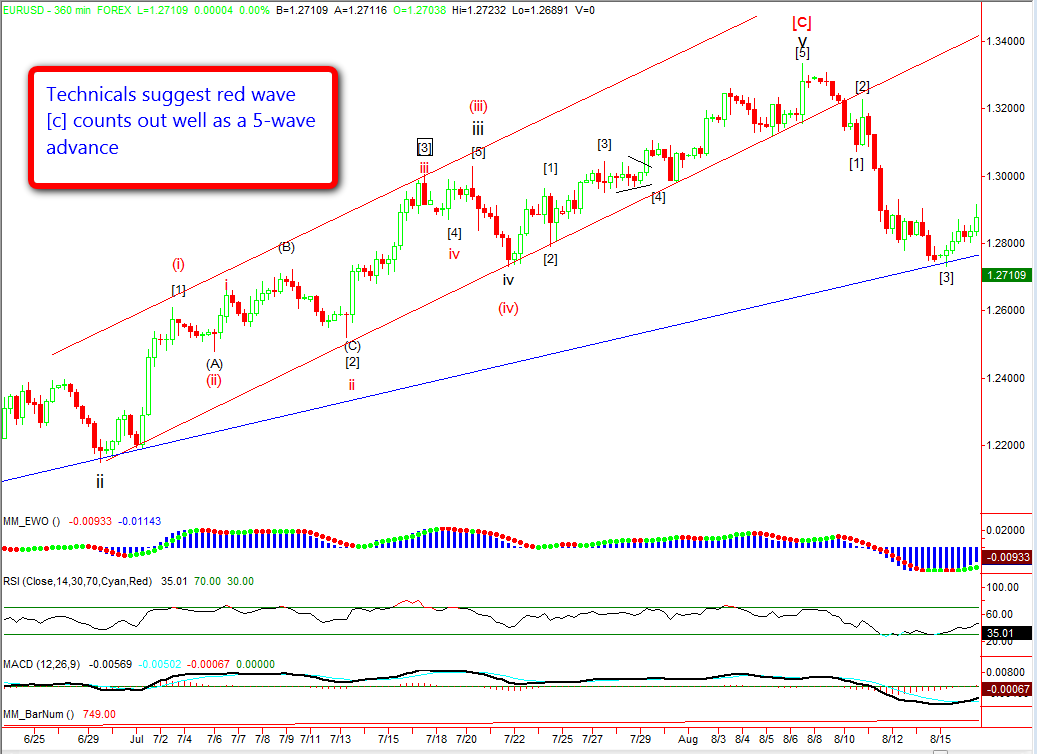
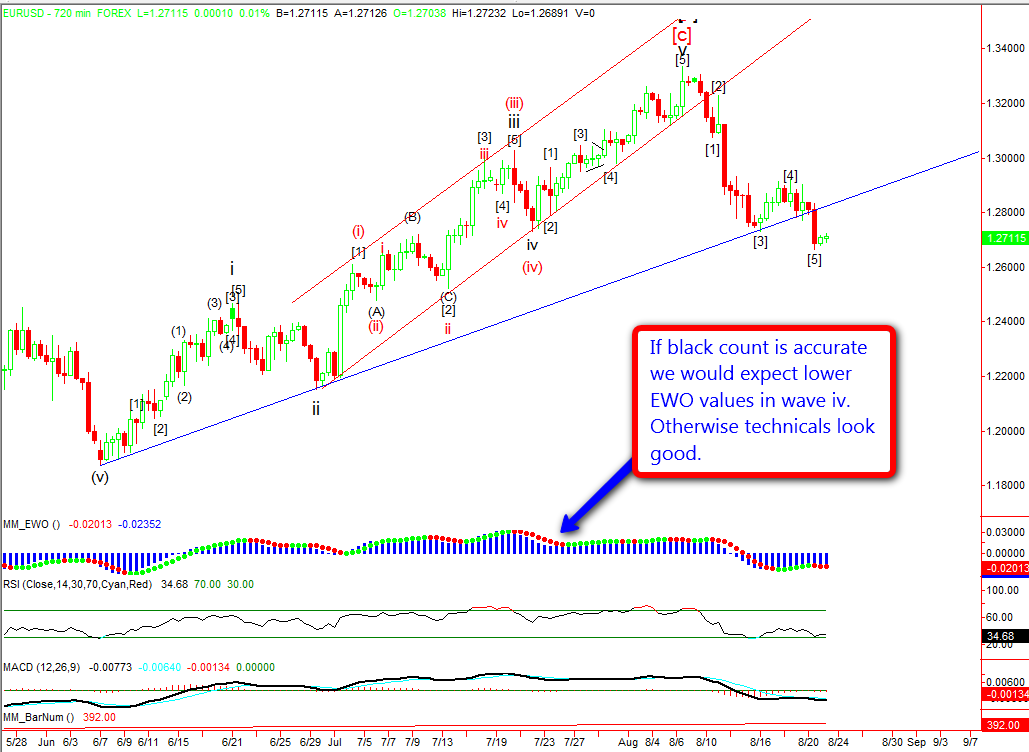
If we ask the technicals to weigh in on the matter, they slightly favor the red count. On a 6-hour chart we can see that all of our signals from RSI and Elliott Wave Oscillator show a classically formed 5-wave adwance for wave [C] of 2. However, if we look at a 12-hour chart to analyze the black count, we see most of the indications we’d expect except that wave [4] on the Elliott Wave Oscillator did not retrace at least 90% of its wave [3] extreme value. Nevertheless, it’s worthwile to consider the plausibility of the black count.
[click image to enlarge]
[click image to enlarge]
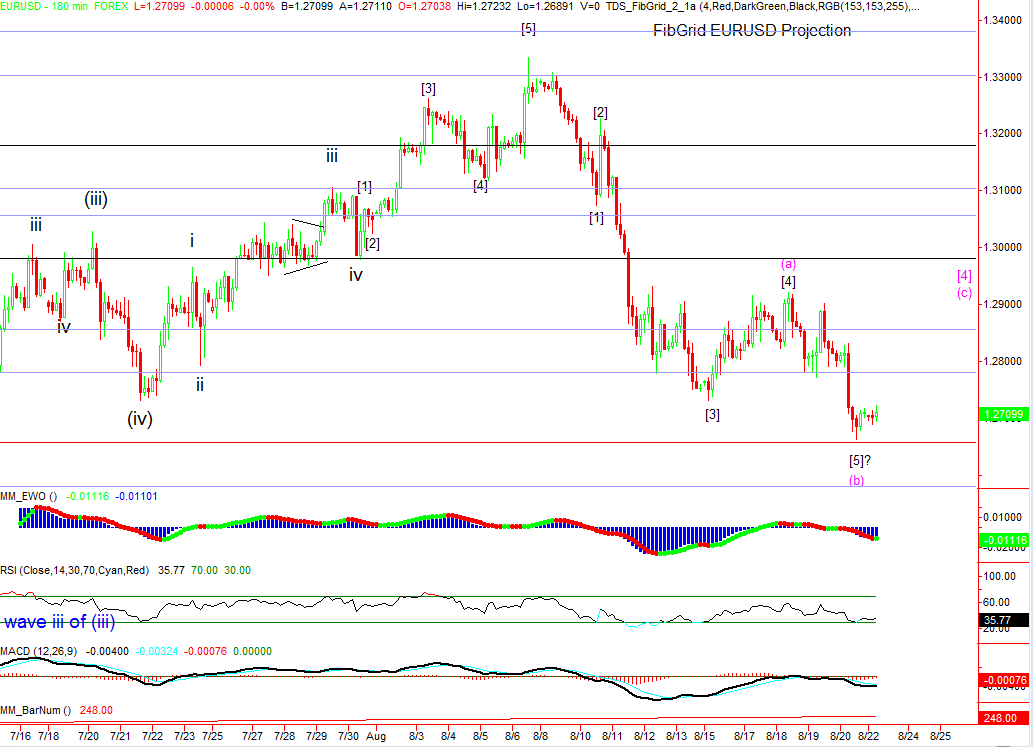
Shorter term, it looks like we are preparing for an upward correction either with or without one more new swing low. If complete, wave [5] would be almost exactly equal to wave [1] as it narrowly missed reaching the fireline. The only thing to give us pause here is the difficulty in counting out five waves within [5] and raising the possibility of one more new low. It also raises the possibility of an expanded flat correction shown in magenta on the 60 minute chart.
[click image to enlarge]
We’ll be looking for signs that reduce the ambiguity as time passes. The long-term outlook for the Euro remains bearish, but we want to have better clarity on the likely path it should take to lower prices.
No Responses to “To everything: turn, turn, turn…” Leave a reply ›