
Dow Weekly
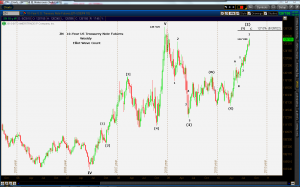
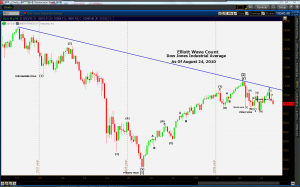
In order to have an understanding of our current count on the Ten Year Bond, we believe it is most helpful to begin with the weekly chart side by side with the Dow Weekly as a comparison to the current wave count.
We first want to start with the June 2007 lows that we have labled Cycle wave IV. If you recall this was the same month of the Lehman Brothers collapse. Obviously this started a “flight to safety” in Bonds. As is typical of a wave 5, it was a fast sharp advance that lasted only until December of 2007, a couple of months after the the highs in the equities market.
Looking at the Dow Jones Industrial chart on the same weekly chart, that high is labled Cycle wave B on the chart. This peak in the DJI occured in October of 2007, which began the equities selloff to the March 2009 lows which we have labled Primary wave [1].
Now, looking at the bonds again you will see that bonds put in a five wave decline which we have labled wave intermediate wave (1). If you will notice, bonds didn’t complete their lows until June 2009, a few months after equities.
The long held belief is that, ” When equities are up, bonds are down. When equities are down bonds are up.” However, placing the two charts side by side, our opinion is that belief no longer holds water and is a dangerous assumption to make.
This inverse relationship may hold true for the short term, but for the longer term we feel like there is another significant high on the near horizon for bonds. Only lagging in time once again, to the wave [2] high in the equities.
Our most recent posts have identified the Primary wave [2] in the Dow as the high of April 23rd as you see on the chart. Since that high the Dow has sold off and Primary wave [3] continues to subdivide into the expected subwaves of this decline.
Bonds, however, have continued to press higher to record a new high today at 126 ‘240. From a closeup count, it appears that this high is the end of a Minor wave 3 of C of a double correction. If my count is correct we should next see a wave 4 correction and when ended should complete the intermediate wave (2) highs then start a decline which we believe will eventually take out the June 2009 lows.
My present target for the wave (2) high is near the 128 ‘000 level where wave C equals 127% of wave A. This target is just under the record high bond price of 2009 at 128 ‘225. This is a very deep wave 2 correction. However as long as it doesn’t take out the previous high our count will be correct.


No Responses to “Are Bonds Topping?” Leave a reply ›