Kevin McEwen
Members of the David Elliott chat room on TOS know me as Kevy99. Some call me the "Wave Master" from my daily postings of my Elliott Wave counts. My passion is following the price movement of the markets and identifying them using the principles of the Elliott Wave as identified by R. N. Elliott. In addition I use the technical indicators developed by David Elliott and our First Wave Trader group to guide me in my trading decisons.
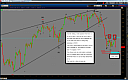
Catching It’s breath
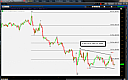
One of the fascinating facets of Elliott wave studies is that it is paints a picture by numbers of the sentiment of investors in the market. With the realease of every new government report it seems to put in an actionary wave. The YM chart above displays the characteristics of the impulse waves to the downside.
Counting […]
A Wave Two to the Seventh Degree
Today’s market action didn’t leave us too surprised. My post this morning said that we were looking to end a subminuette wave ii perhaps in the 50% retracement area. We didn’t quite hit that level but we came close, then the YM’s sold off quickly to the fire line. For most of the rest of […]
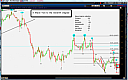
The Overnite YM
The YM bears a close watch right now. It appears that the [a] and [b] waves of ii are in place.
Right now on the hourly chart , we are at the 38% retracement level and the hourly 55, which I mentioned yesterday as a possible area to look for as the end of wave ii. […]
A look at YM last week and the week ahead
This past week, the emini-Dow didn’t disappoint our expectations of the wave structure.
Early Monday it put in a new low from the previous week to end wave (i) and we got our wave (ii) bounce which appears ended near the end of the day on Tuesday. It now looks like wave (iii) is in progress […]
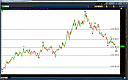
A Head and Shoulders Pattern
I have reviewed the weekly e-mini Dow chart today. It looks to me like a high probability that it has formed a distinct Head and Shoulders pattern that was completed last week. Take a look at this video as I walk you through the pattern and what lies ahead for this pattern.
[flashvideo file=wp-content/Videos/HS815.flv image=wp-content/Videos/HandS.png /]
A possible Drop and POP Today
I am looking to finish wave (i) this morning and then get a wave (ii) retracement.
Keep an eye on the Fireline and the Daily 55 SMA
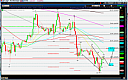
A Wave 2 Fractal
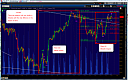
One of the more interesting lessons to learn from Elliott Wave Principle is the fractal nature of wave patterns. Fractal meaning that wave patterns are repetitive in all degrees of waves.
The above chart is an excellent example of this particular prinicple side by side. Observe how I have labeled the chart. The smaller wave (ii) appears to a be finished zig-zag […]
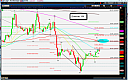
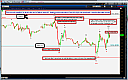
1-2..1-2..1-2 Now 3’s
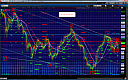
The above chart represents a series of degrees of a wave 1 down followed by a deep wave 2 retracements.
With this last wave i down from the fire line to yesterdays low, it is followed by another deep wave ii retracement of near 76.8%. If we do not take out yesterdays high from here and all the rest of the counts are correct, this is the beginning of a series of larger wave 3’s down. Momentum will pick up to the downside. I don’t want to be long here at all. Volatility is increasing. Hang on.