Kevin McEwen
Members of the David Elliott chat room on TOS know me as Kevy99. Some call me the "Wave Master" from my daily postings of my Elliott Wave counts. My passion is following the price movement of the markets and identifying them using the principles of the Elliott Wave as identified by R. N. Elliott. In addition I use the technical indicators developed by David Elliott and our First Wave Trader group to guide me in my trading decisons.
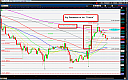
The Fireline Holds Wave (ii)
Our pre-market post identified a possible wave (ii) high at the fireline this morning. So far this is the correct count as all of the major indexes turned lower. The DJI managed to end the day down 140 pts to close below the snowline. This was a particularly low volume day with only 691 million shares traded, which has made […]
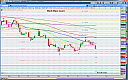
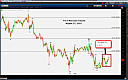
YM Resistance at the “Fire Line”
Overnite trading in the futures contract showed strength at the opening and continued with buying until it spiked through the “Fireline”. However, the resistance at this level may prove to be an indication that the wave (ii) correction is over.
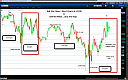
A “Shanghai Duo” on the Weekly Bonds
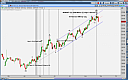
The “Red Candel High” on the daily chart above is signaling a significant high is in on bonds. The Weekly chart also shows a “RCH” which for those familiar with candle patterns (more specifially a “Hanging Man” denoted by a long wick and a close near bottom of the candle) is a bearish indicator. The “hanging man” on the weekly […]
Some Stormy Waves Today
The market showed quite a bit of volatility today. After opening early to the upside, it traded rather flat in anticipation of the Consumer Sentiment Report which was released at 9:55, The report sold the market off rapidly to below the previous low of Wedneday, but immediately reversed with Ben Bernakes speech which began at 10:00 and ended up […]
GDP Numbers This Morning
This has been a big week of economic news and reports. So far most of the reports have been negative and have driven the market lower with each report. We have been noting the effects these reports have had and have been identifying the timing of these reports to our wave counts.
Most bullish investors may […]
Inverse News

The market reversed it pattern this morning on the news. This mornings interpretation of new jobless claims reveresed the pattern of the pre-market news releases this morning. New claims were less than expected. Hurrahhh. Only 473,000 approximately 25,000 less than expected. They call this good news?
The Market popped to a new overnite high on the […]
The last day of the Dow 10,000 Party
The pre-market economic news caused the Dow to open down for the first 30 minutes this morning to a new low for the week. However, it recoverd quickly for the rest of the day.
The wave count suggests that the morning lows were the completion of wave i of (iii) . The remainder of the day […]
A New “Stress Free” Trading Strategy
After spending an incredible amount of hours, counting waves, writing coded studies, studying studies and reading and listening and learning we have finally developed the perfect trading strategy for trading in the Futures Market. It is guaranteed to reduce your stress level and only requires about 30 minutes of your time during the day. (Tongue in […]
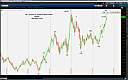
ZN Can Count as Complete
For our Evening Update, we would like to feature the Ten Year Treasurey Note Futures, ZN.
We have been watching the bonds closely but have not commented on them. Today we are taking a look at the weekly and the daily.
In looking at the weekly chart in another post, we traced back the ZN to June […]
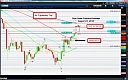
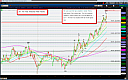
Are Bonds Topping?
In order to have an understanding of our current count on the Ten Year Bond, we believe it is most helpful to begin with the weekly chart side by side with the Dow Weekly as a comparison to the current wave count.
We first want to start with the June 2007 lows that we have labled […]