Archive for the ‘Blogs’ Category
FirstWave Training Videos
Need to know how to trade the FirstWave Indicators? Look no further than these videos on CD that will teach you the secrets of these indicators:
SOAP
MOBO
Map Pattern
Elliott Flat Waves
SnapBack
Linear Regression 3030
CCI
ADX
To purchase these CDs, go to the Wallstreet Teacher’s Website.
A Wave 2 Fractal
One of the more interesting lessons to learn from Elliott Wave Principle is the fractal nature of wave patterns. Fractal meaning that wave patterns are repetitive in all degrees of waves.
The above chart is an excellent example of this particular prinicple side by side. Observe how I have labeled the chart. The smaller wave (ii) appears to a be finished zig-zag […]
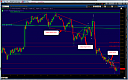
1-2..1-2..1-2 Now 3’s
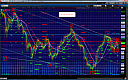
The above chart represents a series of degrees of a wave 1 down followed by a deep wave 2 retracements.
With this last wave i down from the fire line to yesterdays low, it is followed by another deep wave ii retracement of near 76.8%. If we do not take out yesterdays high from here and all the rest of the counts are correct, this is the beginning of a series of larger wave 3’s down. Momentum will pick up to the downside. I don’t want to be long here at all. Volatility is increasing. Hang on.
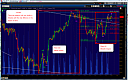
The Big Picture
Here is a bigger picture look at the /YM continuos contract with the Elliott Wave count down from the October ‘o7 highs through the present. The “McFLY” picture from which I base my long term count and as a reference to base my projections on the longer term outlook. The labeling of the chart shows what […]
What a Difference a Year Makes
Do you remember a year ago?
The market was bouncing off the March low into the July earnings reports. All the pundits were talking about about the big “Head and Shoulders Formation” that was pointing to a continuation of the selloff from the October highs and would lead to lower lows. We thought the Daily 50 […]
The Week Ahead
We finished the day Friday with what appears to be a complete 5 waves down labeled as Minuette wave (i). If this count is correct, from here I would anticipate that we have a correction of this structure as an a-b-c wave (ii). Since this is a “First Wave” down from the highs at 10,407 […]
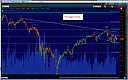
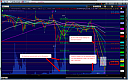
Diagonal Wave Patterns
This is a very interesting example of leading diagonals. Whenever I spot a diagonal I get excited because it gives me a higher probability interpretation of what to expect from the remainder of the wave sturcture.
A leading diagonal can only occur in two positions of a pattern. P87 of EWP states “A leading diagonal always appers as wave 1 of an impulse or wave A of a Zig-Zag”. This example is unusual because we have both, one after another.
It is important in this example because the wave 1 gave first indication that we were in a trend change. This structure developed after an 800 point advance from the July 2nd lows.
The “a” wave diagonal was confirmation of this change in trend because it followed what appeared to be a 1st wave diagonal and the guidlines state that it can only appear as a corrective wave.
The third wave I have marked on the chart is the barrier triangle. This is important to recognize because “a triangle always occurs in a postition prior to the final actionary wave in the pattern of one degree, ie, as wave four in an impulse”. In this particular situation, the triangle appeared towards the end of a steep selloff and is the best indication that one final wave down was about to occur and to alert you to expect a larger degree correction of the five waves down. One of the guidelines to learn is that the length of the fifth wave is generally the length of the widest part of the triangle. In this case the wave v projection was 46 points. It just so happened that the v exceeded expectations by five points. Not bad huh.
Wow! A Big Down Day on Opex
Well the market did’nt disappoint us today. (unless you thought it would continue up). After attempting to continue up in the overnite market, the futures found resistance and failed then started a wave[3] move down that continued throughout the day ending to finish what appears to be a five wave move ending up minus 230 […]
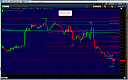
Early Morning Outlook
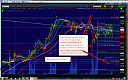
Quite often I find it useful to revisit the big picture to revisit some prior counts in view of the near term differences. I have made some adjustments to my longer term chart to explore some alternate counts.In light of the sharp correction we have had to this point, the above chart looks very possible […]
Daily Update: Like that library book under your bed, a bounce is overdue and may stay that way for a long time

Markets on Wednesday
In the last hour of trading on Wednesday, the S&P 500 broke below the 1040 level that has been cited by pundits as critical supprt. This had served as support throughout the day and helped keep the market trading within a narrow range and when it let go, equities accellerated to the downside. […]